Satellites in Disaster Recovery: Role in Flood and Change Detection

When floods or other natural disasters occur, every minute matters. Today, rescue teams have eyes from above, using satellite imagery, drones, or helicopters. As a result, they get a clear picture of what is happening on the ground, even when roads are cut off or clouds block the view from the aircraft.
Emergency departments now can monitor Earth with live satellite data from radars and optical sensors, discover damaged infrastructure, compare the snapshots with archive images, and understand how landscapes have shifted, developing plans to rescue even the most isolated communities in the hardest-hit places. As a result, people’s lives are saved and recovery strategies are implemented with far greater precision.

Flood Detection Using Satellite Imagery

Specialists monitoring floods today rely on optical remote sensing tools (like Sentinel-2 or Landsat) and the Modified Normalized Difference Water Index for mapping floods. They can show the extent of standing water in open areas and highlight changes in river width.

Nevertheless, accurate flood mapping and surface water extraction can be challenging because optical sensors depend on a clear view of the ground. So during floods, you are more likely to have a heavy cloud cover and darkness, which blocks the signal. Here comes the synthetic-aperture radar systems (SAR) that penetrate clouds and darkness, offering truly all-weather coverage.
The Dartmouth Flood Observatory has logged more than 4,500 significant floods worldwide since 1985, tracking their duration and severity. For instance, in 2010, the average time to create an emergency flood map from satellite data was 2-3 days. Today, up-to-date sensors and upgraded remote satellite sensors deliver results in approximately 2 hours. So, both sensors are vital for detecting floods:

Optical sensors:

  • Reflected sunlight is recorded from Earth’s surface in several wavelengths (visible, near-infrared, short-wave infrared).
  • Water absorbs infrared light, so flooded areas appear dark compared to soil or vegetation.
  • Analysts use MNDWI to highlight flooded zones and compare satellite imagery with pre-flood scenes, mapping changes.

Synthetic Aperture Radar (SAR):

  • SAR sends microwave pulses to the ground and measures the energy that bounces back.
  • Smooth water surfaces scatter little energy, creating very dark patches on the radar image.
  • Microwaves penetrate clouds and don’t depend on daylight, so SAR can provide a live satellite view even during storms or at night.

Monitoring Change Over Time

Dealing with floods means figuring out the true extent of the damage and bringing help to where it’s needed most. Satellites, machine learning, and artificial intelligence make it possible to see how a disaster evolves and understand its impact:

  • Collect data: Obtain pre-event archives and detect the field boundaries of the affected zone.
  • Preprocess: Align scenes and remove clouds or shadows from optical data, and calibrate radar signals so datasets match.
  • Detect change with indices: Calculate NDWI for water, NDVI for vegetation health, and NDMI for soil moisture to describe surface conditions and detect soil erosion or field ruination.
  • Segment and count: Use AI to extract field boundaries or land parcels, then measure how many remain intact or flooded.
  • Quantify stress: Apply statistics to NDVI or moisture values, contrasting damaged and unaffected zones.
  • Report and update: Turn findings into maps or dashboards, refreshing results as new satellite images become available.

Case Study: Life After the Kakhovka Dam Destruction

When the Kakhovka Dam in southern Ukraine collapsed in June 2023 after the Russian attack, the reservoir behind it emptied almost overnight, stripping away more than 1,000 km² of water and leaving bare mudflats. Analysts at EOS Data Analytics turned to current satellite imagery to figure out how the floodwaters spread, then receded, and how the exposed bottom quickly began to dry and crack.

AOI with natural view from Geosat on June 7, 2023, showing how the area was flooded. Image: EOS Data Analytics

The consequences were disastrous. Satellite images highlighted serious environmental and infrastructure concerns. Salt levels had risen sharply, crops across southern Ukraine were stressed, and the cooling pond at the Zaporizhzhia Nuclear Power Plant had lost significant water, putting irrigation and local farming at risk. Though nature showed early signs of recovery, as small shoots of willow and reeds were already sprouting through the exposed silt.

Two Ukrainian ecology experts offer different but complementary views on the future of the former Kakhovka Reservoir. Vadym Maniuk predicted that a young forest with lakes could emerge within 30 years, reaching full ecological balance in about 80 years. Oleksii Angurets highlights that heavy metal contamination near Zaporizhzhia is a matter of concern. Anyway, they both agreed that modern irrigation is essential, but the primary goal is to protect the new habitats.

Key Roles of Satellites in Disaster Recovery

The example of the Kakhovka disaster highlights the vital role satellites play in disaster management. They provide timely and actionable data across flood events, infrastructure, and ecosystems, and support each aspect of recovery.

FunctionSatellite Role
Flood DetectionSAR imagery “sees” through clouds and darkness for real-time inundation mapping
Change DetectionNDVI and NDMI indices help to track vegetation and moisture recovery over time
Infrastructure MonitoringThreats to critical infrastructure facilities are identified.
Ecosystem SurveillanceNatural regrowth and ecological resilience after disaster are monitored.

Toward Smarter Data-Driven Recovery

The Kakhovka Dam disaster shows just how essential satellites have become for recovery efforts. Using optical and radar images in combination with tools like NDVI and NDWI, rescue teams and ecological experts can see how and where floodwaters spread, what the condition of suffering plants is, what actions should be taken, and how to prevent or, at least, minimize the consequences in the future.

The dynamics of water cover change at one of the sites of the former reservoir in the period from June 5, 2023, to June 9, 2024, created using NDVI maps. Source: EOS Data Analytics

This level of insight can’t be achieved only by using the on-site analytics or ground teams. Luckily, satellite imagery is becoming more available for local farmers and communities, as well as for governments and organizations. As a result, humanity can respond more quickly, plan more effectively, and protect both people and the environment, making satellite imagery an integral part of disaster recovery.


Author:
Maksym Sushchuk
With over fifteen years of experience in commercial writing and journalism, Maksym is dedicated to fostering positive change in society, ecology and the environment. His passion lies in using compelling narratives to inspire action and drive sustainable impact, aiming to create a greener, more resilient world through the art of storytelling.

The Amazon Rainforest: History, Biodiversity & What Lies Ahead

The Amazon Rainforest:
Its Past, Present, and Future

The Amazon Rainforest. Raw, wild and absolutely essential to life as we know it. It is one of the most awe-inspiring and ecologically vital regions on the planet. Spanning over nine countries in South America and covering more than 5.5 million square kilometers, it houses unparalleled biodiversity and serves as a lifeline for Earth’s climate. Yet, behind its verdant canopy and teeming rivers lie stories of ancient civilizations, urgent environmental threats, and remarkable resilience.


In this comprehensive guide, we delve into the untold wonders, historical roots, cultural richness, and the alarming challenges facing the Amazon today. From its sprawling river systems and endangered wildlife to the critical role indigenous people play in conservation, this article offers a deep dive into why protecting the Amazon Rainforest isn’t just a regional issue—it’s a global imperative.


Size and Location of the Amazon Rainforest

The Amazon Rainforest is an ecological giant, stretching over 5.5 million square kilometers (2.1 million square miles) and making up over half of the planet’s remaining tropical forests. It is primarily located in South America, spanning nine countries: Brazil, Peru, Colombia, Venezuela, Ecuador, Bolivia, Guyana, Suriname, and French Guiana. Brazil accounts for the largest portion—about 60% of the total forest area—followed by Peru and Colombia. The forest basin is bordered by the Andes Mountains to the west, which play a vital role in shaping its rainfall and river systems.

This immense green expanse is not just a forest but an interconnected network of ecosystems ranging from dense canopy forests and swampy floodplains to seasonal savannas and mountainous rainforests. Its scale is staggering; the Amazon is larger than the entire European Union or nearly equivalent to the contiguous United States. According to NASA, the forest plays a critical role in Earth’s hydrological cycle, generating 20% of the world’s freshwater runoff into oceans (NASA Earth Observatory). The rainforest’s vastness ensures it significantly influences global weather, climate, and biodiversity.


The Origin and History of the Amazon Rainforest

The Amazon Rainforest is estimated to have formed around 55 million years ago, during the Eocene epoch, following the separation of the South American and African tectonic plates. It developed as a tropical forest after the Andean uplift reconfigured the region’s topography and river systems, transforming what was once a giant inland sea into today’s Amazon Basin. This ancient evolution gave rise to one of the most complex and species-rich ecosystems on the planet.


While the ecological story is fascinating, the human history of the Amazon is equally compelling. Contrary to the outdated myth of an untouched wilderness, research has shown that indigenous civilizations have lived in and shaped the Amazon for at least 11,000 years. Archaeological evidence, including complex mound structures, road networks, and terra preta (man-made fertile soil), points to advanced pre-Columbian societies. These early inhabitants used sophisticated agricultural techniques, cultivating crops like cassava and maize while managing forest resources sustainably (Smithsonian Magazine).


Indigenous Peoples of the Amazon Rainforest

The Amazon is home to an incredibly diverse population of over 400 indigenous tribes, many of whom have lived in the forest for millennia. It’s estimated that about 1 million indigenous people inhabit the region, speaking over 300 distinct languages and maintaining vibrant cultural traditions. Notable tribes include the Yanomami, Kayapo, Ticuna, Asháninka, and Huitoto, each with unique cosmologies, rituals, and ecological knowledge deeply rooted in the rainforest.


These communities depend on the forest for food, medicine, and spiritual well-being. They practice sustainable hunting, fishing, and slash-and-burn agriculture (when done traditionally and cyclically) that enhances biodiversity rather than diminishes it. Indigenous stewardship has proven to be one of the most effective strategies for preserving the rainforest’s ecological integrity. A study published in PNAS (2021) found that deforestation rates were significantly lower in indigenous territories compared to other protected areas (PNAS Journal).


Modern-Day Challenges for Indigenous Communities

Despite their proven role in conservation, indigenous communities face significant threats from encroachment, resource exploitation, and political marginalization. Deforestation for logging, cattle ranching, and agriculture often occurs illegally on their lands. Moreover, illegal mining operations bring mercury pollution, violence, and disease. Governments have made efforts to secure land titles and implement protective legislation, but enforcement is inconsistent. Organizations like Survival International and the Amazon Watch are actively working to advocate for indigenous rights and increase global awareness.


The Amazon River: Lifeline of the Rainforest

Flowing for approximately 6,400 kilometers (3,980 miles), the Amazon River is the second-longest river in the world after the Nile, but it easily surpasses all others in water volume. It discharges an astonishing 209,000 cubic meters per second into the Atlantic Ocean—about 20% of all freshwater entering the world’s oceans. Originating from the Andes Mountains in Peru, the river meanders through dense forests and lowland plains, finally emptying into a massive delta in northern Brazil.


The river is the beating heart of the Amazon ecosystem, nourishing vast stretches of rainforest and supporting a remarkable variety of life. It sustains over 3,000 fish species, including the arapaimas, piranhas, and the endangered pink river dolphins. Seasonal flooding enriches the soil and creates unique aquatic habitats like the várzea (whitewater floodplains) and igapó (blackwater floodplains), crucial for biodiversity and nutrient cycling.


Major Tributaries and Navigability

The Amazon is fed by hundreds of tributaries, some of which—like the Madeira, Tapajós, and Negro Rivers—are massive rivers in their own right. These waterways form an extensive network of natural highways that are vital for local transportation and commerce. However, proposals for hydroelectric dams and infrastructure expansion pose serious threats to this delicate system, potentially altering the river’s flow, displacing communities, and affecting fish migration.


According to The Nature Conservancy, maintaining the Amazon River’s health is not only crucial for the ecosystem but also for the millions of people who rely on it for water, food, and transportation (The Nature Conservancy).


Biodiversity in the Amazon Rainforest

The Amazon Rainforest is the most biodiverse region on Earth. It is estimated to be home to 10% of the world’s known species, including over 40,000 plant species, 1,300 bird species, 430 mammals, 1,000 amphibians, and 3,000 types of fish. Every hectare of rainforest might contain hundreds of tree species, many still unknown to science. This remarkable biodiversity is due to the region’s warm climate, high rainfall, and complex web of microhabitats that foster evolution and niche specialization.


One of the most iconic species is the jaguar, the apex predator of the forest, whose stealth and strength help regulate the food chain. The forest is also home to vibrant macaws, curious capuchin monkeys, sloths, and the elusive harpy eagle. Below the forest canopy, the Amazon River and its tributaries teem with unique aquatic life, including the pink river dolphin, giant river otters, and piranhas.


Threatened and Endangered Species

Despite its richness, the Amazon is a battleground for many endangered species. The World Wildlife Fund (WWF) reports that habitat destruction and illegal wildlife trade are pushing species like the giant armadillo, golden lion tamarin, and the black caiman to the brink of extinction (source). Conservationists warn that we’re losing biodiversity faster than we can document it. Many organisms living in the Amazon may vanish before we even discover them, erasing opportunities for future medicines, ecological balance, and scientific knowledge.


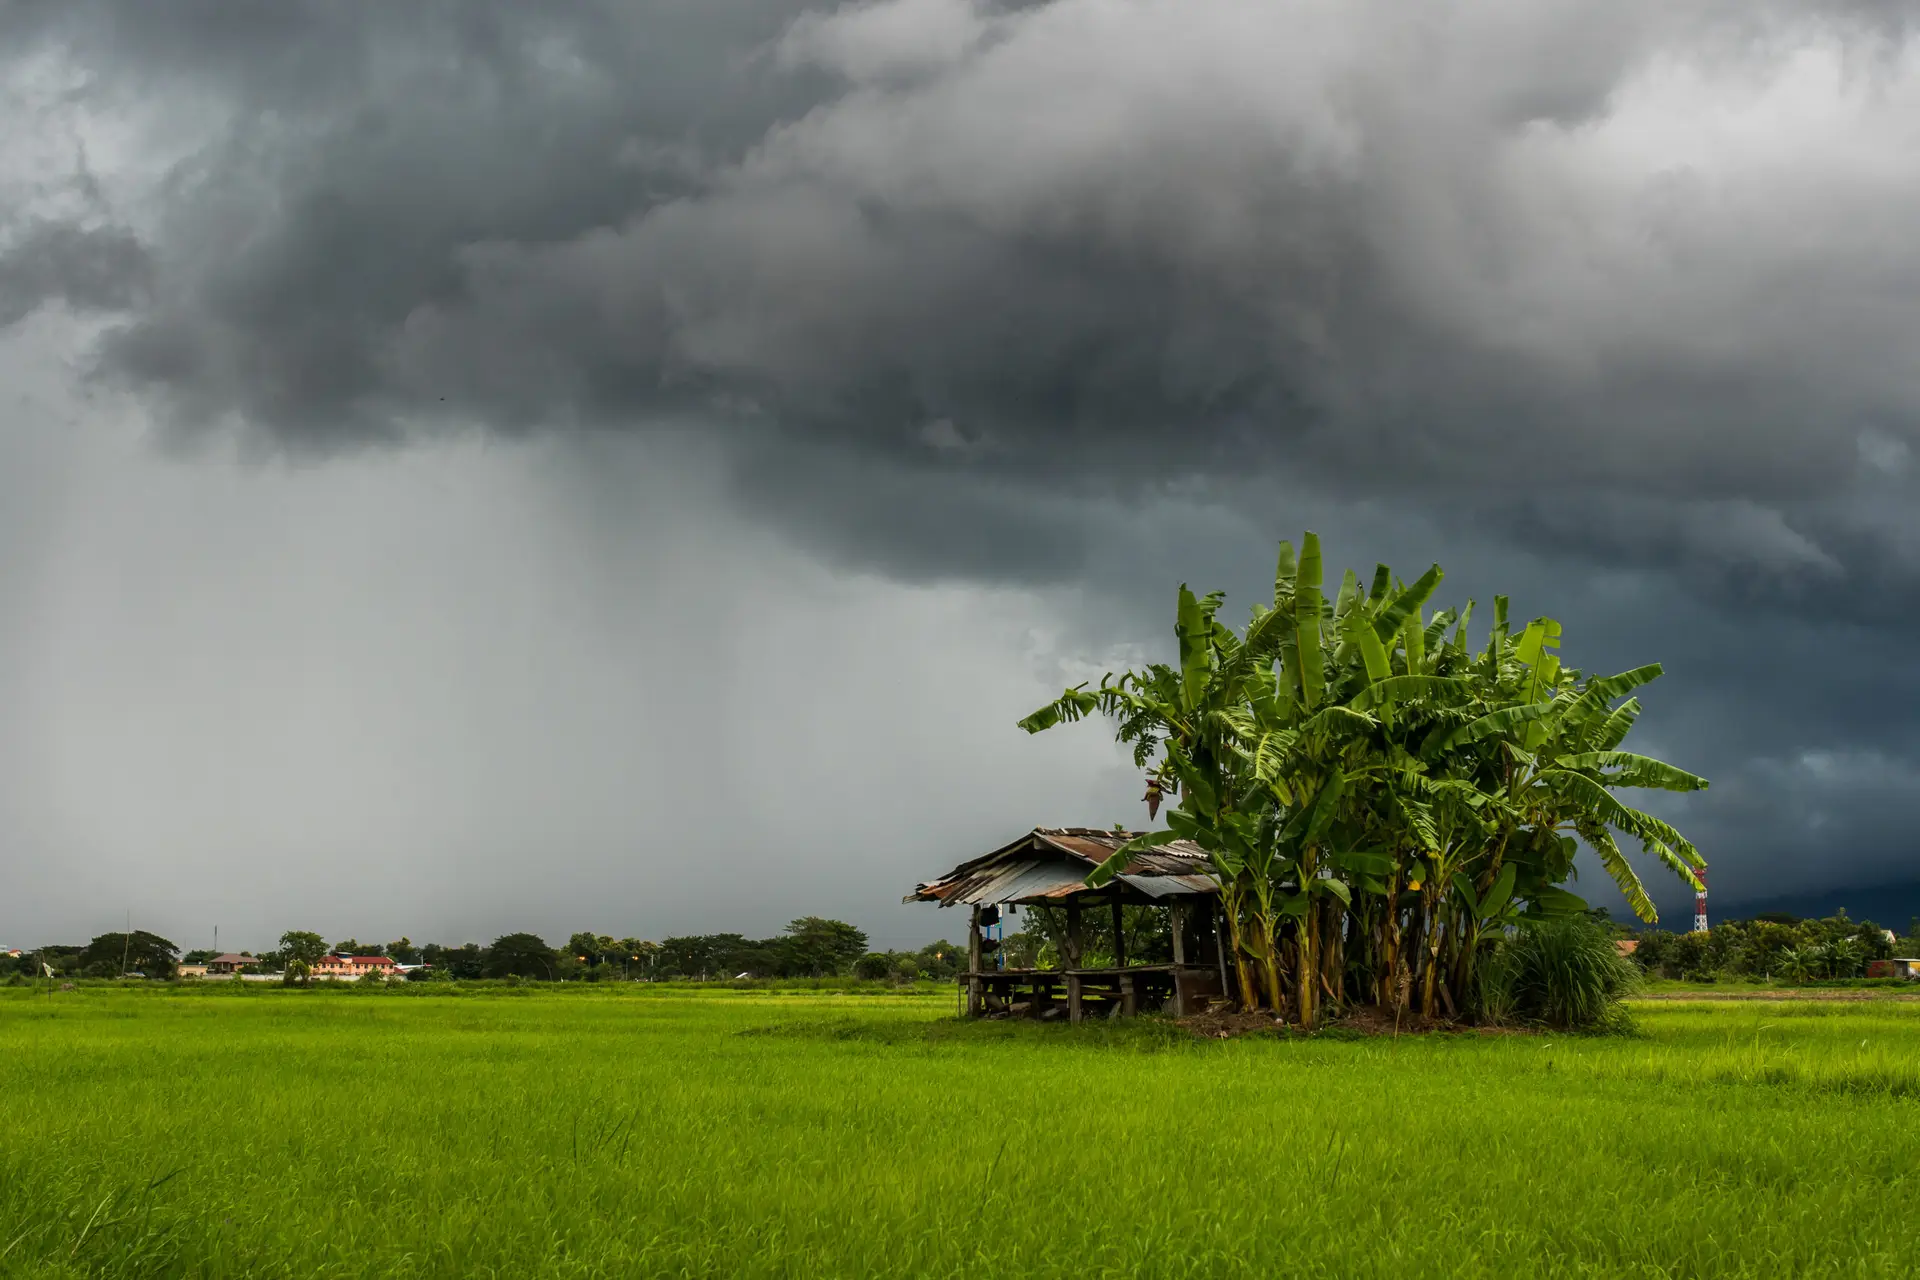
Climate of the Amazon Rainforest

The Amazon’s climate is predominantly tropical and humid, with average annual temperatures ranging between 25°C and 28°C (77°F to 82°F). It receives over 2,000 millimeters (79 inches) of rainfall annually in most areas. This consistent moisture supports a year-round growing season and maintains the lush, green environment.

The rainforest plays a key role in its own weather patterns through evapotranspiration, where moisture is released from trees and contributes to cloud formation and rainfall. This process not only sustains local ecosystems but also affects weather systems as far as North America and Europe.


Effects of Climate Change

Recent studies published in Nature Climate Change and Science Advances reveal that the Amazon is experiencing longer dry seasons and more intense droughts, largely driven by global warming. These changes have made the forest more vulnerable to wildfires, which were once rare but are now becoming increasingly common due to a drier climate and deforestation-induced ignition points (NASA Earth Observatory). These fires threaten both biodiversity and the forest’s ability to function as a carbon sink.


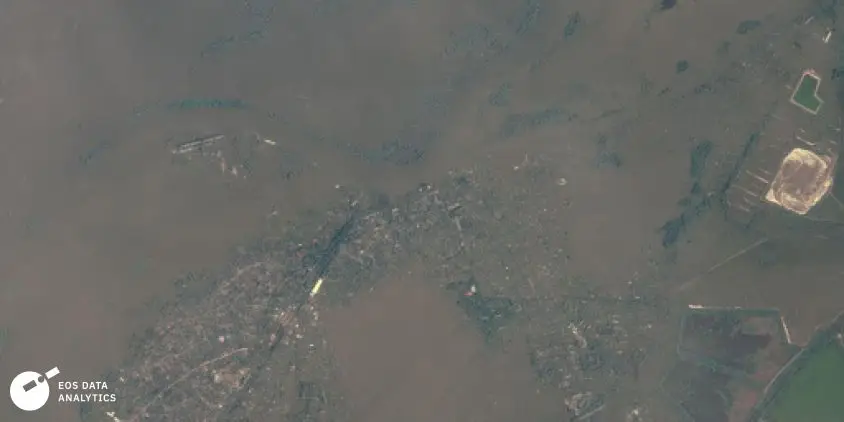
Human Influence on the Amazon Rainforest

Human activity is one of the Amazon’s biggest threats. Over the past 50 years, nearly 17% of the rainforest has been lost, primarily due to deforestation for agriculture, cattle ranching, and infrastructure projects like roads and dams. Brazil, which holds the largest portion of the rainforest, has witnessed intense clearing, especially in the “arc of deforestation”, a zone stretching across the southern Amazon.


Industrial-scale soy farming and cattle grazing are leading causes of tree removal. Large multinational companies often incentivize the destruction of forest lands in pursuit of profit. This pattern not only disrupts ecosystems but also displaces indigenous peoples and fragments wildlife habitats.


Illegal Activities and Enforcement Issues

Illegal logging, gold mining, and poaching are widespread, often facilitated by corrupt officials or weak governance. A 2020 investigation by Mongabay, a respected environmental journalism site, highlighted how illegal gold mining operations contaminate rivers with mercury, threatening aquatic life and human health. Law enforcement faces significant challenges due to the forest’s vastness, remote terrain, and occasional violent resistance from criminal operations.


Impact of the Amazon Rainforest on the Global Climate

The Amazon plays an indispensable role in regulating the Earth’s climate. Its dense vegetation stores about 90-140 billion metric tons of carbon, helping to moderate global carbon dioxide levels and slow down climate change. The rainforest also influences rainfall patterns across continents. For instance, moisture from the Amazon contributes to precipitation in the Midwestern United States, impacting agriculture and water supplies.


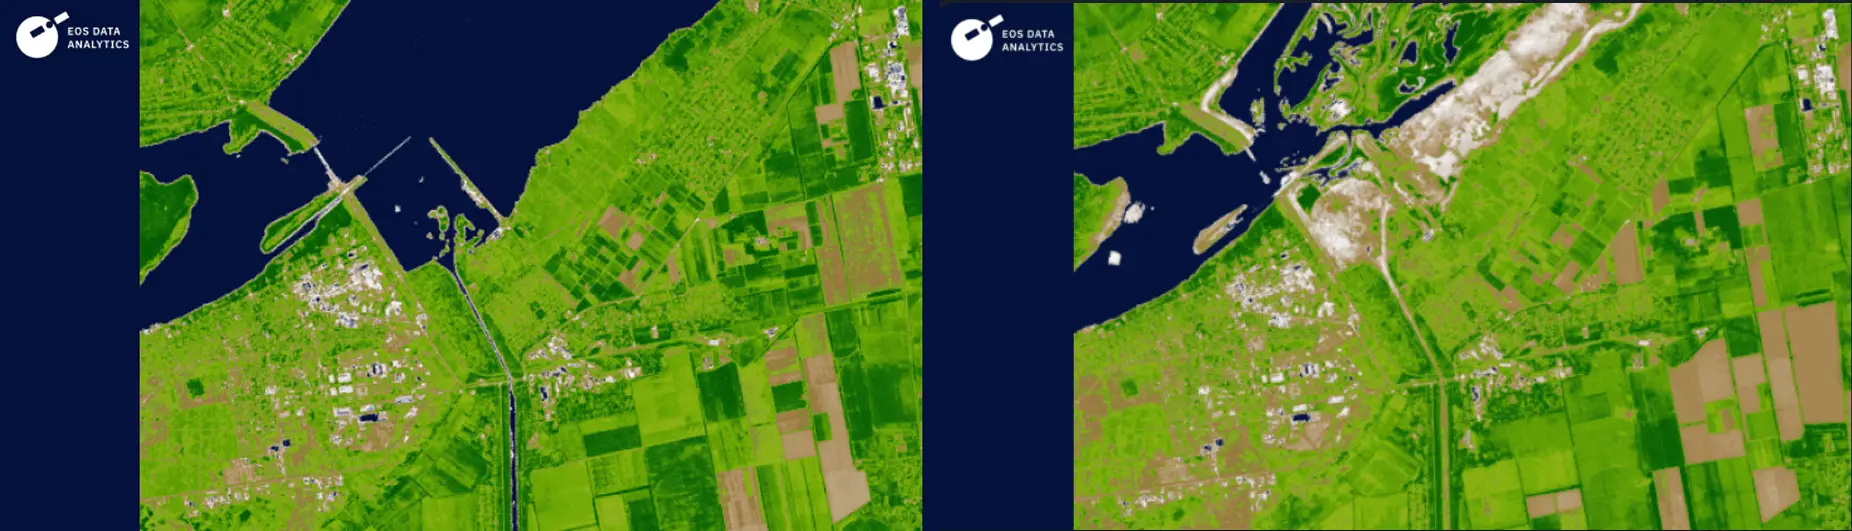
The Rainforest’s Role as a Carbon Sink

Through photosynthesis, the Amazon acts as a carbon sink, absorbing more carbon than it emits. However, recent satellite data analyzed by NASA and the European Space Agency (ESA) show alarming trends: parts of the forest are now releasing more carbon than they store, primarily due to logging and burning (source). If this trend continues, the Amazon could reach a tipping point, beyond which it may no longer support the moisture cycle necessary to sustain itself—a scenario with profound global repercussions.


Protection and Recovery Efforts

Despite the dire threats, global efforts to protect the Amazon are underway. National governments, NGOs, indigenous communities, and international bodies are collaborating to enforce sustainable practices, conserve biodiversity, and restore degraded areas.


Initiatives like REDD+ (Reducing Emissions from Deforestation and Forest Degradation), led by the United Nations, offer financial incentives to countries and landowners for preserving forest cover. NGOs such as the Amazon Conservation Team and Rainforest Alliance work closely with indigenous communities to combine traditional ecological knowledge with modern conservation science.


Reforestation and Indigenous Stewardship

Reforestation efforts, including planting native trees and rehabilitating degraded land, are gaining momentum. However, scientists emphasize that protecting existing forest is far more effective than replanting new ones. Indigenous stewardship plays a pivotal role here. A 2021 study in PNAS (Proceedings of the National Academy of Sciences) found that forests managed by indigenous communities are significantly better preserved than those under government control or private ownership (source).


FAQs About the Amazon Rainforest

1. Why is the Amazon Rainforest called the “lungs of the Earth”?
Because it produces approximately 20% of the world’s oxygen and absorbs vast amounts of carbon dioxide, helping to regulate the global atmosphere.

2. What’s the biggest threat to the Amazon today?
Deforestation, primarily from agriculture and illegal activities, remains the most pressing issue.

3. Can the Amazon Rainforest recover if deforestation stops?
Yes, with time and proper reforestation practices. Natural regeneration can be effective, but active restoration helps speed up recovery.

4. How many indigenous tribes live in the Amazon?
Over 400 tribes live in the Amazon Basin, many with their own languages and cultural traditions.

5. How does the Amazon affect weather in the U.S.?
Moisture from the Amazon contributes to rainfall patterns that affect agriculture and weather in the United States and other regions.

6. What can individuals do to help protect the Amazon?
Support organizations focused on rainforest conservation, reduce consumption of products linked to deforestation (like soy and beef), and raise awareness.


Conclusion: Why the World Must Protect the Amazon Rainforest

The Amazon Rainforest is more than just a lush wilderness—it is a living, breathing system that supports millions of species, indigenous cultures, and the stability of our global climate. Its fate is tied to our own. Continued destruction of this vital biome would mean the loss of irreplaceable biodiversity, the collapse of key weather systems, and an acceleration of climate change.


However, hope remains. With stronger international cooperation, indigenous leadership, and a collective commitment to sustainability, the Amazon can still thrive. We all have a role to play in ensuring that the “lungs of the Earth” keep breathing for generations to come.

Section Title

Satellites in Disaster Recovery: Role in Flood and Change Detection

When floods or other natural disasters occur, every minute matters. Today, rescue teams have eyes from above, using satellite imagery, drones, or helicopters. As a result, they get a clear picture of...

El Niño: A Complete Guide to Causes and Global Impacts

El Niño causes and effects explained. This climate event starts in the Pacific Ocean but impacts global weather, from floods in South America to drought in Africa. Learn how it forms, why it matters...

The Vikings: Ruthless Conquerors or Pioneering Explorers?

The Viking Age revealed: Explore how Norse seafarers became both fearless explorers and ruthless conquerors across Europe and beyond...

Venice: The city that is slowly sinking and flooding

The sinking city of Venice, Italy

Venice, the city of canals and gondolas, is one of the most breathtaking and unique places in the world. Built on 118 small islands in the Venetian Lagoon, it has long been a historical and cultural icon, attracting millions of visitors every year. However, this remarkable city is facing a growing crisis—Venice is sinking and flooding at an alarming rate. But what exactly is causing this? Here are the eight major factors responsible for the city’s gradual descent into the water.


  1. Natural Land Subsidence

Venice is built on soft sediment layers composed of sand, silt, clay, and organic material. Over time, these layers naturally compact due to their own weight and the pressure exerted by the city’s buildings. This process, known as land subsidence, causes Venice to sink at a rate of approximately 1 to 2 millimeters per year.


  1. Heavy Buildings and Infrastructure

The magnificent buildings of Venice, constructed from stone and brick, put additional strain on the city’s delicate foundations. Because Venice was built on wooden piles driven into the sediment, the uneven weight distribution leads to structural imbalances, cracks, and further subsidence. The more construction and restoration efforts take place, the more pressure is added to the city’s already fragile foundation.


  1. Mass Tourism and Overcrowding

Venice is one of the world’s most visited cities, receiving millions of tourists every year. The overwhelming number of visitors, combined with construction activities to support tourism, puts significant pressure on the city’s infrastructure. Bridges, public spaces, and water systems experience wear and tear, accelerating structural damage and increasing maintenance costs.


  1. Tectonic Movements

Venice is also affected by geological forces beneath the surface. The shifting of the Adriatic Plate and the Apennine Mountains contributes to the natural subsidence of the city. These slow-moving tectonic shifts alter the stability of the lagoon’s sediment layers, increasing the likelihood of minor tremors and structural weakening.


  1. Groundwater Extraction

During the early to mid-20th century, groundwater extraction was a major cause of Venice’s sinking. Industries in the nearby Marghera area, as well as the city’s growing population, demanded large amounts of water. As water was pumped out, the soil beneath Venice started to compact more rapidly, accelerating subsidence. By the late 1960s, authorities recognized the damage and significantly reduced or stopped groundwater extraction to slow down the sinking process.


  1. Acqua Alta – Seasonal High Tides

One of the most visible and immediate threats to Venice is Acqua Alta, the temporary flooding that occurs mainly in autumn and winter. Acqua Alta is caused by a combination of factors:

  • Spring tides during full or new moons amplify gravitational forces, raising water levels.
  • Strong scirocco winds from the Sahara push water northward into the Adriatic Sea and Venetian Lagoon.
  • Low atmospheric pressure reduces the force pressing down on the sea, allowing water levels to rise.

When these factors align, severe flooding can inundate the city, causing disruptions and damage to historic structures.


  1. Extreme Weather and Climate Change

Climate change is making Venice’s flooding problems worse. More frequent and intense storms, heavy rainfall, and rising temperatures contribute to higher water levels in the lagoon. When combined with Acqua Alta and strong winds, these conditions increase the severity and frequency of floods, putting Venice at greater risk.


  1. Rising Global Sea Levels

Perhaps the most alarming factor in Venice’s future is global sea level rise caused by climate change. As polar ice caps melt and ocean temperatures increase, sea levels continue to rise. Higher water levels make high tides even more extreme, leading to frequent and severe flooding. If global warming continues unchecked, Venice’s future as a livable city may be in jeopardy.


Can Venice Be Saved?

With all these threats, is there a solution to save Venice? While the answer is complex, several efforts are being made to protect the city.


MOSE Flood Barrier System

The MOSE system with the city on the left and the sea on the right.


The MOSE system is Venice’s most ambitious flood protection project. This system consists of 78 mobile barriers installed at lagoon inlets to block rising tides, such as Acqua Alta, from flooding the city. Initially planned for completion in 2011, the project faced numerous delays, budget overruns, and political scandals. However, it became operational in 2020, with final completion expected soon. MOSE can protect Venice from tides up to 3 meters (10 feet), safeguarding critical areas like Piazza San Marco.


Additional Measures

Besides MOSE, Venice has implemented other flood mitigation efforts:

  • Elevating infrastructure such as streets and public spaces.
  • Improved drainage systems and water pumps.
  • Water-resistant restoration techniques for historic buildings.
  • Sediment management in the lagoon to maintain water balance.
  • Regulations on large ships to prevent further erosion.
  • Climate adaptation strategies to prepare for future changes.

The Future of Venice

The fight to save Venice is ongoing. While technological solutions like MOSE and improved infrastructure provide hope, the city’s survival ultimately depends on long-term strategies addressing climate change and responsible tourism. Public awareness and global efforts to combat rising sea levels are crucial to ensuring that Venice remains a cultural treasure for generations to come.

Venice’s story is a cautionary tale about the delicate balance between nature and human intervention. As we admire its beauty, we must also recognize the urgent need to protect it.

The unique man-made climate of New York City

The unique man-made climate
of New York City

It may surprise many that NYC is classified as humid subtropical under the Köppen climate system—despite its famously snowy winters. This unique classification comes from a complex mix of natural geography and intense urban development. From towering buildings to endless pavement, human activity has reshaped the city’s climate dramatically. In this article, we’ll explore how New York’s weather is defined, how it compares to surrounding areas, and what role the urban heat island effect plays in shaping daily life. Whether you’re a local, a visitor, or a climate enthusiast, you’ll gain a fresh perspective on NYC’s ever-changing weather.


Understanding the Köppen Climate Classification

The Köppen climate classification system was developed by German climatologist Wladimir Köppen to group global climates based on temperature, precipitation, and seasonal patterns. New York City falls into the Cfa category, which stands for humid subtropical. This type of climate is typically associated with hot, humid summers and relatively mild winters without a dry season.


Interestingly, parts of NYC also exhibit traits of the Dfa classification—humid continental—characterized by greater seasonal temperature differences, including colder winters. However, due to human influence and geographic factors, the city remains officially categorized as Cfa.


How Urbanization Impacts NYC’s Climate

New York City’s classification as a humid subtropical zone is significantly influenced by its dense infrastructure. Without this urban sprawl, NYC might shift toward the humid continental category. The presence of concrete, steel, and human activity raises average temperatures, particularly at night and during the winter months. This phenomenon, known as the urban heat island effect, traps heat within the city, preventing the kind of deep freezes common in more rural areas nearby.


The difference becomes most noticeable during winter. While cold winds from Canada regularly sweep through the region, the city remains 2 to 3 degrees Celsius warmer on average than surrounding towns. This added warmth helps maintain its subtropical status.


Climate Zones Around NYC

Just beyond the five boroughs, the climate begins to change. Northern suburbs and parts of upstate New York fall into the Dfa category, with colder winters and lower humidity. In contrast, areas like Long Island and the Hudson Valley often retain the Cfa classification due to their coastal exposure and, in some cases, the extended reach of the urban heat island.


While urbanization is a major factor in NYC’s climate, geography also plays a role. The nearby Atlantic Ocean moderates extreme temperatures, and NYC’s relatively low elevation further contributes to its mild winter profile.


Rainfall and Seasonal Precipitation

New York City experiences rainfall throughout the year, with no true dry season. On average, annual precipitation reaches about 1,250 millimeters (50 inches). Spring tends to be the wettest season, while February is typically the driest, although every month sees at least some rain. This consistent precipitation supports a diverse range of urban greenery and contributes to the city’s changing seasonal moods.


Storms are common, particularly during summer when warm, moist air masses from the south clash with cooler air from the north. These encounters often produce sudden, intense rainfalls, accompanied by thunder and lightning.


Summer in NYC: Heat, Humidity, and Haze

Summers in New York are characteristically warm and often uncomfortably humid. Daily highs frequently exceed 30°C (86°F), and the humidity can make the air feel even warmer. Although cooling breezes occasionally drift in from the Atlantic, they often aren’t enough to offset the trapped heat from the city itself.


Most summer winds arrive from the southwest, carrying warm, moist air into the metropolitan area. Heat waves, sometimes lasting several days, are increasingly common and can strain the city’s energy grid while creating health risks for residents—especially the elderly and those in underserved neighborhoods.


Winter Weather: Cold, but Moderated

Winters in New York are cold, but not as frigid as those in interior northeastern states. January and February bring the lowest average temperatures, often dipping below freezing. Still, the city is relatively insulated from the worst of the cold thanks to both urban heat and the nearby Atlantic.


Snowfall is a regular occurrence, but the city’s warmer ground temperatures and salty sea air often turn it quickly to slush. Blizzards do happen—especially when Atlantic moisture meets cold, continental air—but they are generally more disruptive than long-lasting.


Transitional Seasons: Spring and Fall

Spring in New York typically begins with cool temperatures in March and gradually warms through April and May. It’s often marked by rainy days and sudden temperature swings. By late spring, the weather turns pleasant and green spaces throughout the city burst into bloom.


Fall starts off warm and gradually cools toward the winter months. September and early October can feel like an extension of summer, but by November, jackets are essential. Autumn is also peak season for hurricanes and tropical storms. A vivid example of this was Hurricane Sandy in 2012, which made landfall in late October, causing massive flooding, power outages, and long-term infrastructural damage across the five boroughs.


Why NYC’s Subway Heats Up in Summer

One of the most extreme examples of the urban heat island effect can be felt underground. During summer, the New York City subway becomes intensely hot, often exceeding 40°C (104°F) on platforms and in tunnels.


The combination of train air conditioners releasing heat, insufficient ventilation, and radiated warmth from pavement above creates a stifling environment. Despite improvements in modern train cooling systems, station design continues to challenge temperature control, making the subway one of the city’s least comfortable places in summer.


Extreme Temperatures in NYC’s History

New York City’s climate range is wide. The hottest recorded temperature was 41°C (106°F) in 1936, while the coldest plunged to -26°C (-15°F) in 1934. These extremes reflect NYC’s position between temperate and continental zones, as well as the changing influence of global climate trends.


While such temperatures are rare, recent years have shown an increase in weather volatility, with more frequent heat waves and unseasonal snowfalls, reinforcing concerns about long-term climate change.


Climate Change and the City’s Future

In 2019, NYC became one of the first U.S. cities to declare a climate emergency. This bold move reflected growing concerns over rising sea levels, more frequent extreme weather events, and increased heat-related illnesses.

Forecasts suggest the city could face up to 57 days annually above 32°C (90°F) by mid-century—up from around 18 days today. Annual precipitation is expected to increase by 13%, and sea levels are projected to rise by about 3 cm (1.2 inches) per decade.


In response, the city is investing in adaptive infrastructure: building seawalls, reinforcing subway tunnels, expanding green roofs, and improving emergency response systems. These efforts aim to future-proof a city already grappling with the realities of a warming world.


Conclusion: A Climate Shaped by City and Sea

New York City’s climate may officially be labeled “humid subtropical,” but the full story is far more complex. It’s a dynamic balance between natural forces and human design, geography and infrastructure, Atlantic winds and urban heat. The Köppen classification offers a useful lens, but the lived experience of NYC’s climate is as layered and unique as the city itself.


Whether it’s a snowstorm in February or a blazing subway platform in July, the city’s weather continues to challenge, surprise, and define daily life for millions.