
When floods or other natural disasters occur, every minute matters. Today, rescue teams have eyes from above, using satellite imagery, drones, or helicopters. As a result, they get a clear picture of what is happening on the ground, even when roads are cut off or clouds block the view from the aircraft.
Emergency departments now can monitor Earth with live satellite data from radars and optical sensors, discover damaged infrastructure, compare the snapshots with archive images, and understand how landscapes have shifted, developing plans to rescue even the most isolated communities in the hardest-hit places. As a result, people’s lives are saved and recovery strategies are implemented with far greater precision.
Flood Detection Using Satellite Imagery
Specialists monitoring floods today rely on optical remote sensing tools (like Sentinel-2 or Landsat) and the Modified Normalized Difference Water Index for mapping floods. They can show the extent of standing water in open areas and highlight changes in river width.
Nevertheless, accurate flood mapping and surface water extraction can be challenging because optical sensors depend on a clear view of the ground. So during floods, you are more likely to have a heavy cloud cover and darkness, which blocks the signal. Here comes the synthetic-aperture radar systems (SAR) that penetrate clouds and darkness, offering truly all-weather coverage.
The Dartmouth Flood Observatory has logged more than 4,500 significant floods worldwide since 1985, tracking their duration and severity. For instance, in 2010, the average time to create an emergency flood map from satellite data was 2-3 days. Today, up-to-date sensors and upgraded remote satellite sensors deliver results in approximately 2 hours. So, both sensors are vital for detecting floods:
Optical sensors:
- Reflected sunlight is recorded from Earth’s surface in several wavelengths (visible, near-infrared, short-wave infrared).
- Water absorbs infrared light, so flooded areas appear dark compared to soil or vegetation.
- Analysts use MNDWI to highlight flooded zones and compare satellite imagery with pre-flood scenes, mapping changes.
Synthetic Aperture Radar (SAR):
- SAR sends microwave pulses to the ground and measures the energy that bounces back.
- Smooth water surfaces scatter little energy, creating very dark patches on the radar image.
- Microwaves penetrate clouds and don’t depend on daylight, so SAR can provide a live satellite view even during storms or at night.
Monitoring Change Over Time
Dealing with floods means figuring out the true extent of the damage and bringing help to where it’s needed most. Satellites, machine learning, and artificial intelligence make it possible to see how a disaster evolves and understand its impact:
- Collect data: Obtain pre-event archives and detect the field boundaries of the affected zone.
- Preprocess: Align scenes and remove clouds or shadows from optical data, and calibrate radar signals so datasets match.
- Detect change with indices: Calculate NDWI for water, NDVI for vegetation health, and NDMI for soil moisture to describe surface conditions and detect soil erosion or field ruination.
- Segment and count: Use AI to extract field boundaries or land parcels, then measure how many remain intact or flooded.
- Quantify stress: Apply statistics to NDVI or moisture values, contrasting damaged and unaffected zones.
- Report and update: Turn findings into maps or dashboards, refreshing results as new satellite images become available.
Case Study: Life After the Kakhovka Dam Destruction
When the Kakhovka Dam in southern Ukraine collapsed in June 2023 after the Russian attack, the reservoir behind it emptied almost overnight, stripping away more than 1,000 km² of water and leaving bare mudflats. Analysts at EOS Data Analytics turned to current satellite imagery to figure out how the floodwaters spread, then receded, and how the exposed bottom quickly began to dry and crack.
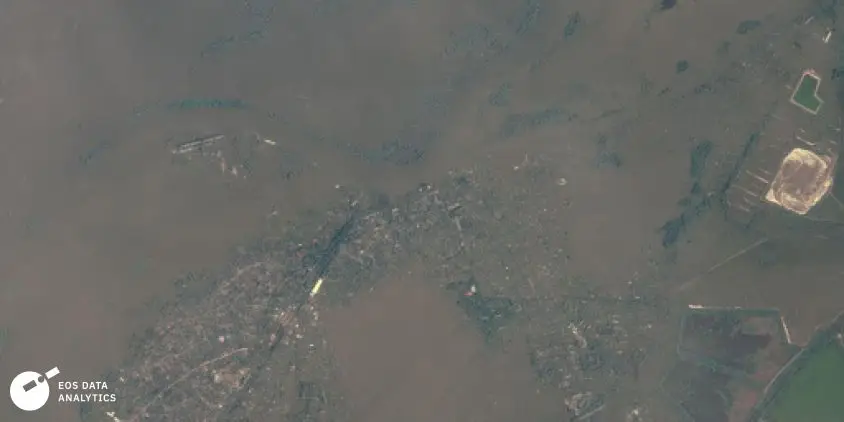
AOI with natural view from Geosat on June 7, 2023, showing how the area was flooded. Image: EOS Data Analytics
The consequences were disastrous. Satellite images highlighted serious environmental and infrastructure concerns. Salt levels had risen sharply, crops across southern Ukraine were stressed, and the cooling pond at the Zaporizhzhia Nuclear Power Plant had lost significant water, putting irrigation and local farming at risk. Though nature showed early signs of recovery, as small shoots of willow and reeds were already sprouting through the exposed silt.
Two Ukrainian ecology experts offer different but complementary views on the future of the former Kakhovka Reservoir. Vadym Maniuk predicted that a young forest with lakes could emerge within 30 years, reaching full ecological balance in about 80 years. Oleksii Angurets highlights that heavy metal contamination near Zaporizhzhia is a matter of concern. Anyway, they both agreed that modern irrigation is essential, but the primary goal is to protect the new habitats.
Key Roles of Satellites in Disaster Recovery
The example of the Kakhovka disaster highlights the vital role satellites play in disaster management. They provide timely and actionable data across flood events, infrastructure, and ecosystems, and support each aspect of recovery.
| Function | Satellite Role |
| Flood Detection | SAR imagery “sees” through clouds and darkness for real-time inundation mapping |
| Change Detection | NDVI and NDMI indices help to track vegetation and moisture recovery over time |
| Infrastructure Monitoring | Threats to critical infrastructure facilities are identified. |
| Ecosystem Surveillance | Natural regrowth and ecological resilience after disaster are monitored. |
Toward Smarter Data-Driven Recovery
The Kakhovka Dam disaster shows just how essential satellites have become for recovery efforts. Using optical and radar images in combination with tools like NDVI and NDWI, rescue teams and ecological experts can see how and where floodwaters spread, what the condition of suffering plants is, what actions should be taken, and how to prevent or, at least, minimize the consequences in the future.
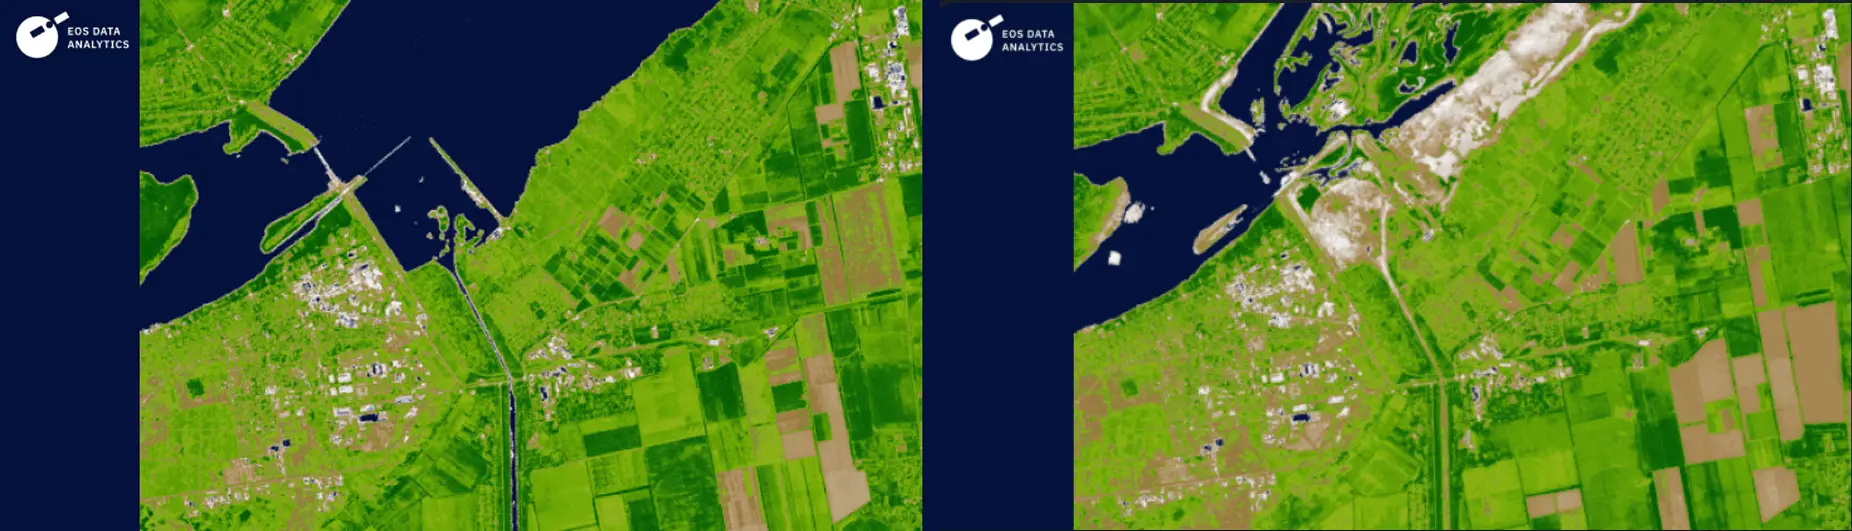
The dynamics of water cover change at one of the sites of the former reservoir in the period from June 5, 2023, to June 9, 2024, created using NDVI maps. Source: EOS Data Analytics
This level of insight can’t be achieved only by using the on-site analytics or ground teams. Luckily, satellite imagery is becoming more available for local farmers and communities, as well as for governments and organizations. As a result, humanity can respond more quickly, plan more effectively, and protect both people and the environment, making satellite imagery an integral part of disaster recovery.
Author:
Maksym Sushchuk
With over fifteen years of experience in commercial writing and journalism, Maksym is dedicated to fostering positive change in society, ecology and the environment. His passion lies in using compelling narratives to inspire action and drive sustainable impact, aiming to create a greener, more resilient world through the art of storytelling.